UC2 — Continuous LOS Relay
Abstract
Every satellite produces exactly one file at the start of the run. While the constellation is operating, we inject a continuous, randomised stream of hardware faults (network failures, bandwidth reductions, disk full / disk failure) on satellites and ground stations alike. The experiment measures how long it takes for every produced file to reach at least one ground station, and which fraction never makes it inside the time budget. Compares EDFS against TUS.
Success Condition
The run ends successfully once a single ground station holds at least 95% of
the produced files. Every satellite produces exactly one file, so the file
count x equals sat_count; the generator sets the ground-station receive-only
agent to a fixed SUCCESS_AFTER_FILES = floor(0.95·x) − 1 (clamped to ≥ 1) with
SUCCESS_BROADCAST=true. The first GS to reach that many distinct files
publishes experiment/end-request{SUCCESS}, which the experiment-executor
confirms against the authoritative crud-events stream and records as Success.
If max_duration (6h) fires first, the run ends TimedOut and the fraction of
files that did arrive is the delivery-success rate — that partial-delivery
outcome is itself a data point (see Main goal).
The
− 1margin pulls the effective threshold below 95% at smallsat_count(6/8 atn08, 1/2 atn02) and converges to ~95% as the file count grows (94/100, 189/200).
Detailed description
At t=0 every satellite agent writes one file of fixed size and exits — so
the number of distinct files in flight is sat_count. The seven ESTRACK
ground stations run a multi-receiver agent that keeps logging RECEIVED
events for every distinct file it sees and stays alive until the experiment
ends.
A per-fsNode hardware-event schedule is generated up front and stamped into
each Behaviour.hardwareEvents so the run is fully reproducible (the
operator's CRD validation already ensures Destroy is rejected for
recurring schedules; we use only the non-terminal fault types). Default
fault intensity: on every fsNode, on every fault type, one occurrence
every 5m (intervalJitterPercent: 50) lasting 30s-60s
(durationJitterPercent: 50). This produces "roughly 10-15% of fsNodes in
some kind of fault state at any given moment" — degraded but not crippled.
Fault menu (no Destroy here; that's UC4's domain):
NetworkBandwidthReducedwithcapBitsPerSec: 100 kbpsNetworkFailure(full link drop)DiskFullDiskFailure
The run ends when (a) all files are received by at least one GS, or (b) the
maxDuration (default 6h) timer fires — whichever comes first. The
latter case is itself a data point.
Main goal
Quantify delivery completeness and time-to-all-delivered under realistic operational faults. The hypothesis is:
- EDFS achieves ≥ 95% delivery success rate even under the fault stream, because the DHT replicates each file across multiple peers and any of those replicas can be the one that meets a GS.
- TUS degrades faster: a fault on the producer's link during its only contact window with a GS loses that file for the whole run.
KPI: delivery success rate ≥ 95% for EDFS at every sat_count; TUS is expected to fall below.
Parameters
| Parameter | Values | Notes |
|---|---|---|
engine |
tus, edfs |
Both engines are tested under the same fault schedule. |
priority |
low, default, high |
Set via the producer agent's FILE_PRIORITY. |
sat_count |
1, 2, 8, 21, 100, 200 | Same Walker-like sweep as UC1. |
RF |
1, 3, 5 — EDFS only | Probes "is more replication actually helpful here?" |
gs_count |
fixed at 7 (ESTRACK) | |
file_size |
32M |
One regime per UC2 run; we sweep RF/sat_count rather than file size to keep the deliverable set focused. |
max_duration |
6h |
Tight enough that "still in flight at the deadline" actually counts against the success rate. |
TUS parameter coverage. TUS has no notion of file priority or
replication factor — priority and RF are ignored by the engine.
For TUS we therefore only sweep (sat_count) (under the same per-run
fault schedule), pin priority=default and omit
RF. Each TUS run is compared against the full (priority, RF)
matrix of EDFS runs at the same sat_count and the same fault seed.
Assumptions
- The inter-ground-station network is broadband and disturbance-free. Every
pair of ground stations is treated as permanently linked, independent of
orbital line-of-sight: the link is fixed at 10 Gbit/s with zero packet loss,
and only its propagation delay scales with the great-circle distance between
the two stations. Satellite links, by contrast, exist only while the two nodes
are in line-of-sight and their bandwidth degrades with distance. The only event
that can disturb a ground-station-to-ground-station link is a hardware failure
injected as a
HardwareEvent(e.g.NetworkFailureorNetworkBandwidthReduced) on one of the two stations.
Additional metrics
Beyond yass_file_delivery_seconds histogram (filtered to "any-GS
delivery"):
- Delivery success rate:
count(distinct files received by ≥1 GS) / sat_count. - "Critical replication time" — wall-clock at which the
delivery_success_ratereaches each of{50%, 90%, 95%, 100%}. - Per-fsNode and aggregate:
yass_container_cpu_millicores,yass_container_memory_bytesyass_network_tx_bytes_total,yass_network_rx_bytes_total- Fault overlay (for cross-correlation, not a KPI):
yass_hardware_event_active{type}from the timeline dashboard so we can see which files happen to be in flight during which fault windows. - Total network cost:
sum(yass_network_tx_bytes_total)aggregated over the whole constellation for the run. Plain bytes shipped — engine- agnostic, no made-up coefficients. Useful for comparing the relative cost of EDFS replication vs. TUS bounce-and-forward under the same fault stream.
Charts
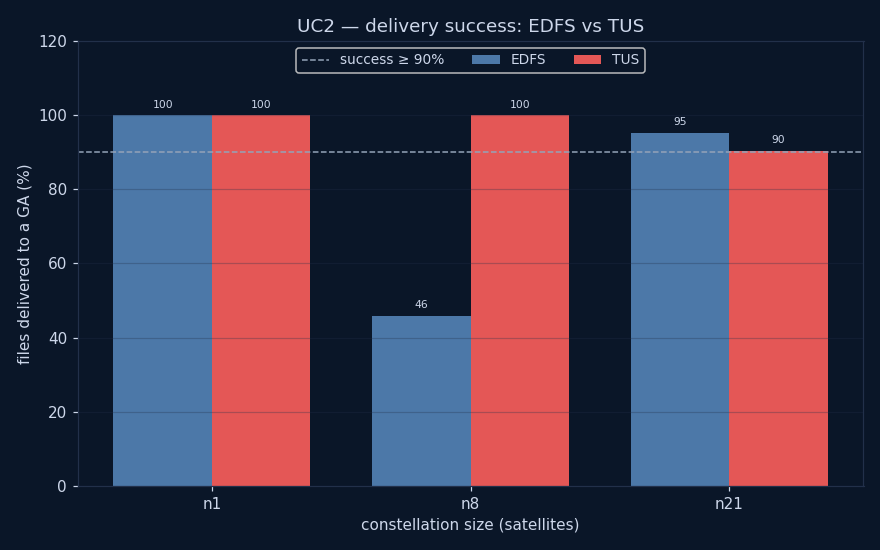
Variants (20)
| variant | engine | priority | RF | sat | produced | files→GS | all? | lastGS(s) | status | delivered % |
|---|---|---|---|---|---|---|---|---|---|---|
| uc2-edfs-pdefault-n01-rf3 | edfs | default | 3 | 1 | 1 | 1 | yes | 754 | Success | 100% |
| uc2-edfs-pdefault-n02-rf3 | edfs | default | 3 | 2 | 0 | 0 | no | n/a | Failed | 0% |
| uc2-edfs-pdefault-n08-rf1 | edfs | default | 1 | 8 | 6 | 1 | no | 9 | Failed | 12% |
| uc2-edfs-pdefault-n08-rf3 | edfs | default | 3 | 8 | 6 | 6 | yes | 1283 | Failed | 75% |
| uc2-edfs-pdefault-n08-rf5 | edfs | default | 5 | 8 | 7 | 4 | no | 837 | Failed | 50% |
| uc2-edfs-phigh-n08-rf3 | edfs | high | 3 | 8 | 0 | 0 | no | n/a | Failed | 0% |
| uc2-edfs-plow-n08-rf3 | edfs | low | 3 | 8 | 6 | 6 | yes | 6309 | Failed | 75% |
| uc2-edfs-pdefault-n21-rf3 | edfs | default | 3 | 21 | 21 | 20 | no | 833 | Success | 95% |
| uc2-edfs-pdefault-n100-rf1 | edfs | default | 1 | 100 | 100 | 5 | no | 283 | Failed | 5% |
| uc2-edfs-pdefault-n100-rf3 | edfs | default | 3 | 100 | 100 | 5 | no | 548 | Failed | 5% |
| uc2-edfs-pdefault-n100-rf5 | edfs | default | 5 | 100 | 46 | 46 | yes | 1836 | Failed | 46% |
| uc2-edfs-phigh-n100-rf3 | edfs | high | 3 | 100 | 30 | 100 | yes | 2290 | Failed | 30% |
| uc2-edfs-plow-n100-rf3 | edfs | low | 3 | 100 | 100 | 16 | no | 21076 | Failed | 16% |
| uc2-edfs-pdefault-n200-rf3 | edfs | default | 3 | 200 | 200 | 200 | yes | 4424 | Success | 100% |
| uc2-tus-n01 | tus | - | — | 1 | 1 | 1 | yes | 742 | Success | 100% |
| uc2-tus-n02 | tus | - | — | 2 | 2 | 2 | yes | 2817 | Success | 100% |
| uc2-tus-n08 | tus | - | — | 8 | 8 | 8 | yes | 4122 | Success | 100% |
| uc2-tus-n21 | tus | - | — | 21 | 19 | 19 | yes | 4961 | Success | 90% |
| uc2-tus-n100 | tus | - | — | 100 | 0 | 0 | no | n/a | Failed | 0% |
| uc2-tus-n200 | tus | - | — | 200 | 0 | 0 | no | n/a | Failed | 0% |